
Data Made Visual
Infographic Design Services
Turning Complex Information Into Clear Stories
Dense data and complicated processes lose readers fast. Our infographic designers transform statistics, research, and step-by-step guides into visual stories that are easy to scan, easy to share, and easy to remember.
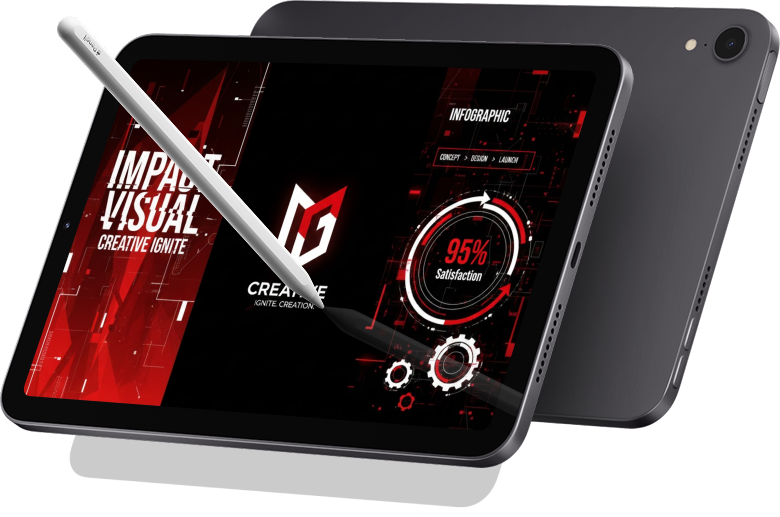

Clarity at a Glance
Infographics That Educate, Engage, and Earn Links
A well-crafted infographic does more than look good. It simplifies your message, keeps visitors on the page longer, and attracts backlinks when other sites reference your data. We combine research, information hierarchy, and on-brand illustration to make your knowledge truly shareable.
Start Your Project With Us-

 250+
Projects Delivered
-
150+
Satisfied Clients
-
10+
Years Of Experience
-
98%
Client Retention Rate
Visual Communication
Infographics for Every Marketing Goal
From blog content and sales decks to social posts and annual reports, our infographics help your audience understand what matters in seconds rather than minutes.
- Statistical & Data Infographics
- Process & Timeline Visuals
- Comparison & List Graphics
- Interactive & Animated Versions

What We Create
Infographic Formats Designed Around Your Content
Every topic needs a different visual structure. We choose the format that makes your information easiest to absorb.
Statistical Infographics
Charts, graphs, and icons that make survey results and research findings instantly readable.
Contact usProcess Infographics
Step-by-step flows that explain how your product, service, or workflow actually works.
Contact usTimeline Infographics
Chronological visuals that tell your company story or map out a project roadmap.
Contact usComparison Infographics
Side-by-side layouts that help buyers weigh options and see why you are the better choice.
Contact usSocial Micrographics
Bite-sized visuals cut from larger pieces, sized perfectly for social feeds and carousels.
Contact usReport & Presentation Graphics
Data visuals for annual reports, whitepapers, and pitch decks that impress stakeholders.
Contact usReady to Grow? Or Just Want to Chat?
Let’s Build Something Exceptional Together
Whether you have a massive plan or just a rough idea on a napkin, Bixbite Marketing is here, ready to help you find the way forward. Let’s connect to discuss your goals.
Book a Free CallCase Studies: The Evidence Of Our Impact
How We’ve Helped Brands Reach Their Biggest Goals
Ohio Storm Fastpitch
Ohio Storm Fastpitch is a premier youth softball organization focused on developing high-level athletes and preparing them for collegiate competition. While the program excelled on the field, its website and digital presence didn’t reflect the energy or competitiveness of the brand. Through our performance-focused design and targeted digital marketing, Ohio Storm saw stronger engagement, increased inquiries, and measurable growth in program visibility.
- Digital Marketing
- SEO
- Content Writing
-
+38%
Increase in Tryout Inquiries
-
+300K
Online Views Generated

Our Process
From Raw Data to Shareable Story
We treat every infographic as a piece of content strategy, not just a design task.
Research & Outline
We gather your data, verify sources, and identify the single story the graphic needs to tell.
Wireframe & Hierarchy
A content wireframe arranges information so the eye follows a natural, logical path.
Illustration & Design
Our designers bring the layout to life with on-brand colors, icons, and typography.
Delivery & Distribution
You receive web, print, and social versions ready to publish, share, and pitch for backlinks.
Insights & Ideas
Stay Ahead with Bixbite Blogs

- Uncategorized
- |
- 05/08/2026
How to Build a Brand People Remember: Beyond the Logo
In an era of 5-second attention spans and AI-generated noise, a “pretty logo” is just the price of admission. It... Read More

- Uncategorized
- |
- 05/08/2026
Top 10 Mistakes Businesses Make Online
In a digital landscape that feels increasingly crowded, most businesses are shouting into a void. It’s easy to think that... Read More

- Uncategorized
- |
- 12/31/2025
Digital Survival: Why “Just Having a Website” Isn’t Enough in 2026
If you launched a business twenty years ago, you needed a listing in the Yellow Pages. Ten years ago, you... Read More
Begin a Conversation
Your Journey to Digital Success Starts Here
Have a burning question, a breakthrough idea, or a vision for your brand’s growth? Our team is ready to jump in and help. Whether you need a high-performance strategy or just want to explore what’s possible, reach out, and let’s see how we can build something incredible together.

Email Address

Phone

Address
Toringdon Way, Suite 200, Charlotte NC, 28277

Working Hours
Mon – Fri: 9:00 AM – 6:00 PM
Get In Touch With Us
Got Questions?
Clear Answers for Your Digital Journey
We know that starting any project comes with a long list of queries. That is why we’ve laid out honest, straightforward responses to the things people usually ask, giving you the clarity you need to move forward with confidence.
